...
Introduction
This paper ...
| Anchor | ||||
|---|---|---|---|---|
|
...
Requirements
- Provide traditional levels of availability in a cloud environment, (5NINES)
- Provide a monitoring and event detection framework that distributes fault information to various listeners with very low latency (<10's of milliseconds)
- Provide a local remediation controller that can react quickly (<10's of milliseconds) to host faults, communicate the filtered fault information to local VMs or containers for quick reaction by the application / service.
- For a cloud infrastructure, the network assumes a larger role in availability than individual compute hosts. Provide fast detection and localization (host vs switch) of network failures through interface monitoring, path fault detection, and interaction with an the underlying software defined network control (For example, ODL)
- Provide availability mechanisms for both current virtualization environments and future containerization environments orchestrated by container management applications like Kubernetes, etc.
- Leverage the fast fault relay platform to provide a common transport mechanism for faults, events, telemetry, and logging.
- A high-availability framework cannot have humans in the remediation and recovery process if 5NINES of availability is a goal. Logging information is provided for detailed, postmortem analysis of infrastructure problems.
| Anchor | ||||
|---|---|---|---|---|
|
...
CoSP Requirements And Definitions
The following sections briefly introduce definitions and terminology that will be used in the remainder of the document.
| Anchor | ||||
|---|---|---|---|---|
|
Network Element (NE) - a physical (PNF) or virtualized (VNF) element deployed in the network.
...
Service Availability (A) - the probability that an entity can provide its associated, specific service (or services) at any instant. Service is available when the system is able to fulfill the arriving new service requests (this property is also referred as Service Accessibility). Typically expressed as A=uptime / (uptime+downtime), also often written as A=MTBF/(MTBF+MTTR) with "R" in MTTR having slightly different meanings depending on redundancy configuration. In ETSI NFV REL documents (REL-001), this aspect of availability is referred as "Service Accessibility".
...
Telecommunications services are generally classified as part of the "critical infrastructure" by the regulatory bodies, and have various performance objectives that are set by the regulators and/or standardization bodies, including requirements for outage reporting and penalties associated for non-compliances, which are service and/or region specific. Implicitly, the infrastructure (in the context of this document this includes NFVI and VIM services) that is used to provide these services becomes part of the critical infrastructure and is subject to certain requirements in terms of availability, continuity, security, disaster recovery etc. In addition to regulatory constraints, the service outages cause direct (in terms of penalties and lost revenues) and indirect (in terms of customer churn, reputation etc.) monetary losses for the operators. While the service criticality, outage impact and other parameters vary by service, the most critical services (e.g. regulated services and safety-relevant services such as 911 call handling) determine the availability and reliability related design targets for the underlying infrastructure.
As compared to the physical and/or software based network element designs of the past telecommunication networks, move to SDN/NFV controlled infrastructure and general trend of "network softwarization" changes both the business relationships between the suppliers and operators, as well as the implementation responsibilities of the associated R&A related mechanisms. Generally, in the past network elements were vertically integrated systems where NE supplier was responsible for all aspects of the system design, integration and testing, including reliability and availability related mechanisms. While such systems commonly utilized commercial hardware and software components (including open source SW such as Linux), the responsibility for the availability related metrics from the operator's perspective was always associated with the system supplier. In cases where the system incorporated 3rd party hardware and/or software, then any "flow-down" requirements and potential responsibilities for associated performance penalties for the sub-suppliers were established by mutual agreement(s) of the system supplier (NE vendor) and its technology suppliers. To the some extent this model continues with the large network equipment vendors (NEPs) in the context of the NFV system, i.e. NEP takes the OpenStack and Linux distribution and "hardens" it to meet their "carrier grade" performance objectives and sells the resulting system to the operators. However, this model is against the objectives of the NFV targets set by the operators, which include the breaking of the vertically integrated vendor specific "silos" to e.g. separate hardware, infrastructure software and application SW (VNFs) vendor specific parts. In the early adoption phase where the NFV system is presently, the lack of standards or mutually agreed open source solutions leads to the NEPs and/or leading operators to fill the associated gaps as they see fit. While the resulting systems may be able to meet the functional and non-functional requirements, including the service availability and continuity related performance metrics and targets they fail on the interoperability aspects - no two implementations are same, and associated interfaces and APIs are also different, which makes each combination of system components (HW, NFVI, VIM, VNFM, NFVO, OSS/BSS etc.) integration exercise that someone needs to undertake. While at least some of the large NEP customers are working to enhance the VIM/NFVI level components, only some of them are open sourcing the associated work to differing degrees, while others are keeping the enhancements for themselves. The result is continuing fragmentation of the NFV system, which in the worst case is directly visible for the VNF - system interfaces as needed to support interoperability in both execution environment interfaces (VNF to VIM) as well as to interfaces between VNF to MANO system.
The key objective of the SA work is to work with the NEPs, network operators, open source communities and projects to establish an open source based solution to address the availability and reliability related aspects of the decomposed system (currently focused on NFVI and VIM parts of the ETSI reference architecture).
Traditionally, in the context of the specific network element design, the services and associated service availability and service continuity objectives were specified at the high level, and associated downtime targets allocated to the hardware and software subsystems in the context of the specific implementation architecture constrained system configurations. The allocations of the performance objectives were typically determined based on the prescriptive modeling in early stages of the design (using R&A models of the configuration based on common modeling practices such as reliability block diagrams and/or markov reward models), followed by the testing and/or field data performance driven validation of the models in later stages (process called "descriptive modeling", which used the same model but driven by the actual measured performance parameters). The same processes were also used to allocate the availability related performance objectives (such as un-availability, remediation times, fault coverage, etc. parameters) between the parties involved on the realization of the system. Same high level processes can be used to establish a basis understanding of the relationships between the services provided by the applications and the services provided by the infrastructure that they application services depend on, as well as the associated service availability and continuity related objectives. However, due to diversity of the application designs, services and service specific targets, as well as variation on the infrastructure implementation options, we are necessarily limited to general relationships and high level objectives only rather than full, application instance specific design and analysis. This exercise is still considered to be useful for establishing the generic understanding on the availability related targets flowing down from the high level (application / VNF level) performance objectives. For simplicity, the following overview uses RBDs for basis of establishment of the high level relationships of the availability of the VNFs in the context of NFV system. The intent here is not to be a tutorial on availability modeling, see e.g. NFV ISG REL-003 document for the background material in the NFV context. It should also be noted that RBDs are not sufficient to fully model complex time-based behaviours (such as failure rates, recovery times and fault coverage), but unlike MRMs, they are easy to construct, understand and compute and sufficient for establishment of basis for high level allocations based on structural relationships and dependencies between software and hardware elements.
A common numerical availability target associated with the so called "carrier grade" systems that we are required to be able to meet in NFV systems as well is 5NINES Availability or higher (there are elements that require higher availability level targets), but this is generally considered to be the low threshold for the "carrier grade" availability. As availability target is meaningless without specifying availability of "what" along the target, this generally is taken to mean 99.999% availability of a specific network element and its associated service(s), i.e. network element availability across the population of network elements of same type, translating to DPM target of ~315 sec/NE/year. The target is sufficiently high that, at least when combined with service continuity requirement it is expected to imply the need for some level of redundancy (at least two components in e.g. active-standby redundancy configuration). Since our hypothetical virtualized network element relies on at least the NFVI+VIM, as well as GVNFM+NFVO services for its operation, we can draw a following high level series RBD that establishes these dependencies:
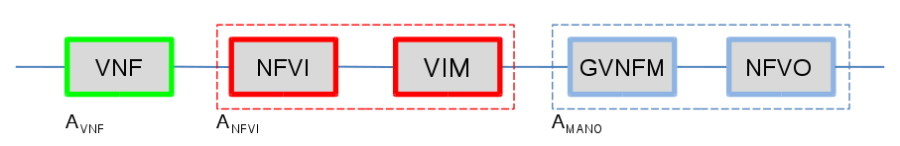
From the above, we can see that for the service to be available, both blocks need to be available. We can also see that to meet the service availability target of 5NINES, each of the components in series need to be more available than 5NINES (as it is unreasonable to expect the NFVI+VIM+GVNFM combination to be 100% available, even with redundancy). Note that the availability of the series RBD can be obtained by multiplying the availabilities of individual components, or alternatively by adding the associated component DPMs. So, if we would have each of blocks 5NINES available, the combined availability would be .99999^3=.99997, which translates to unavailability of 1-A * 31536000 sec/y = 946 sec/y, i.e. one third of the target. The high level process of target setting is referred to availability allocation, and is generally done based on allocation of downtime in terms of time rather than using NINES (although both are equivalent, downtime is much easier to use as an performance objective).
To further expand the above example, we can incorporate a bit more detail by drawing a more detailed RBD as follows to account to parallel-series relationships of the VNF components and services that are within each top level block:
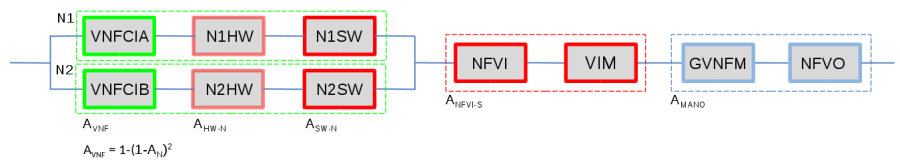
If the combined availability of the VNF SW components, its embedded OS instance and all of the supporting node HW and SW components of the single node is three nines (0.999), the availability associated with the dual-redundant VNF instantiated in anti-affinity configuration in two independent, homogeneous compute nodes N1 and N2 will be 1-(1-.999)^2 = 0.999999, i.e. six nines for the pair. Since the pair depends on the VIM and other MANO functionality for the remediation operation (i.e. failover), it depends on those components that are in series, and their availability needs to be considered to determine the VNF availability. When we combine the VNF in node pair availability with the series elements (NFVI+VIM shared components and rest of the MANO system), we get total availability for the chain of: .999999 (VNF) x .999999 x .999999 = .999997, which is well over 5NINES (based on assumed 6NINES availability of the critical path functionality in the VIM and MANO elements). Note that as this is the simple RBD calculation, the other aspects such as fault detection coverage, failover failure probability, or failover time are not modeled (implied assumption is 100% coverage for service affecting faults, zero failover time and perfect failover - which are all unrealistic in real implementation), and the time spent on the associated processes add directly to the downtime (Service Un-Availability). Therefore, this is a maximum possible availability that can be achieved. This is key reason for why the critical path from the fault management cycle (from the fault detection to the end of remediation phase) needs to be completed as quickly as feasible - even with the redundancy in place, until the remediation processes have been completed, the service is down from the user's perspective.
From our very simple (i.e. simplest possible) high-availability workload configuration with only two VNF Component Instances, we could already see that to achieve the 5NINES performance by the application, we will need to have better than 5NINES performance for the critical infrastructure services that the application depends on (such as network, storage when used, and API services that are used by the application VNF e.g. to perform remediation and recovery actions). In reality, the VNFs have internal structure, are composed of multiple VNFCIs with potentially differing redundancy configurations, and their corresponding RBDs look significantly more complex than previous example. It is not uncommon that single complex VNF would have 5-10 stages of components in series on the associated RBD, and the move towards microservices architectures that operators are pushing vendors towards will increases this even more. Furthermore, the services are composed of chains of the NEs (physical and/or virtual), which increases the number of elements that the service depends on. All this means that for the equivalent Service Availability, the availability of the chained elements (and the elements of the infrastructure they depend on) must be proportionally higher. In addition, from the OpenStack cloud shared services perspective, a realization of many network services requires use of components located in multiple clouds even in the single operator scenario - typical configuration to support end to end service would have at least three separate clouds in series: access/edge cloud 1, core cloud, and access/edge cloud 2, which implies that we will have three independent openstack service regions in series within the overall chain. The following picture, taken from ETSI NFV REL-003 is an illustrative example of availability effect from E2E service availability perspective, where the blue blocks represent the availability of service chains within the specific cloud instances. 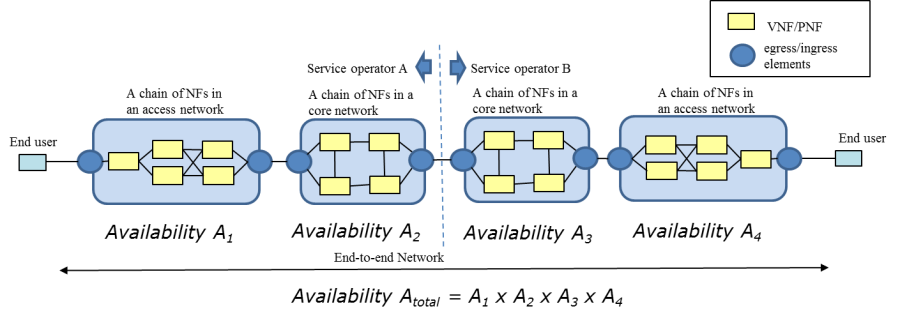
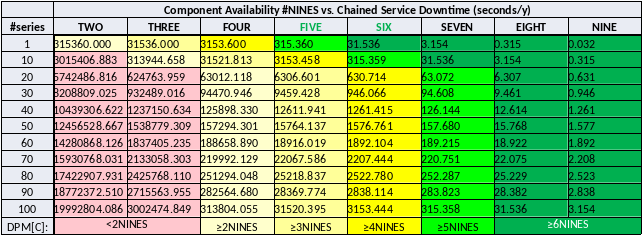
To illustrate the cumulative effect of the homogeneous chained elements to the Service Availability, the following table provides an overview of the expected availability expressed in number of NINES (based on RBD only calculation, which have the limitations outline before, i.e. the associated performance statement is optimistic). As a target setting, NFV system should be able to support applications (VNFs, VFs) / services at least in yellow and light green zones.
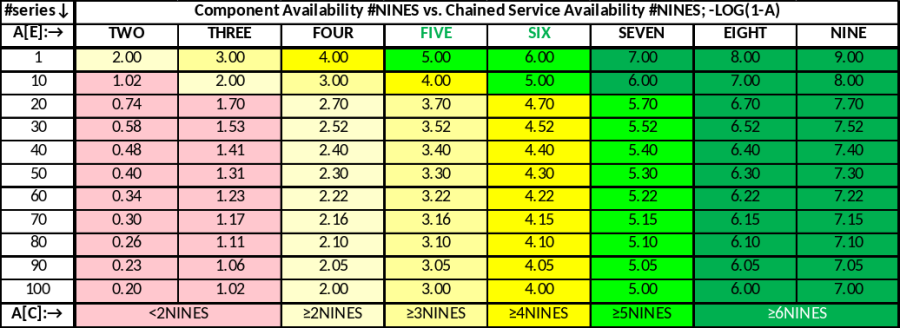
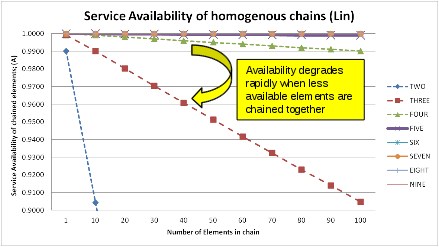
Same table as a (linear) graph illustrates the effect of individual chain element availability (also, keep in mind that the chain availability cannot be higher than the availability performance of the lowest performing element in the chain:
Finally, equivalent in the DPMs (Seconds/NE/Y or Seconds/Service/Y, depending on the scope of the top level availability specification):
The top level allocations of the DPM based on 10% of total NE and/or service downtime (typical from similar systems from the past efforts, and also stated performance by competition) looks like follows:
...